
MFI Bullish Divergence?
Neither this post, nor any other on cryptofal.com should be taken as financial advice. It is not.
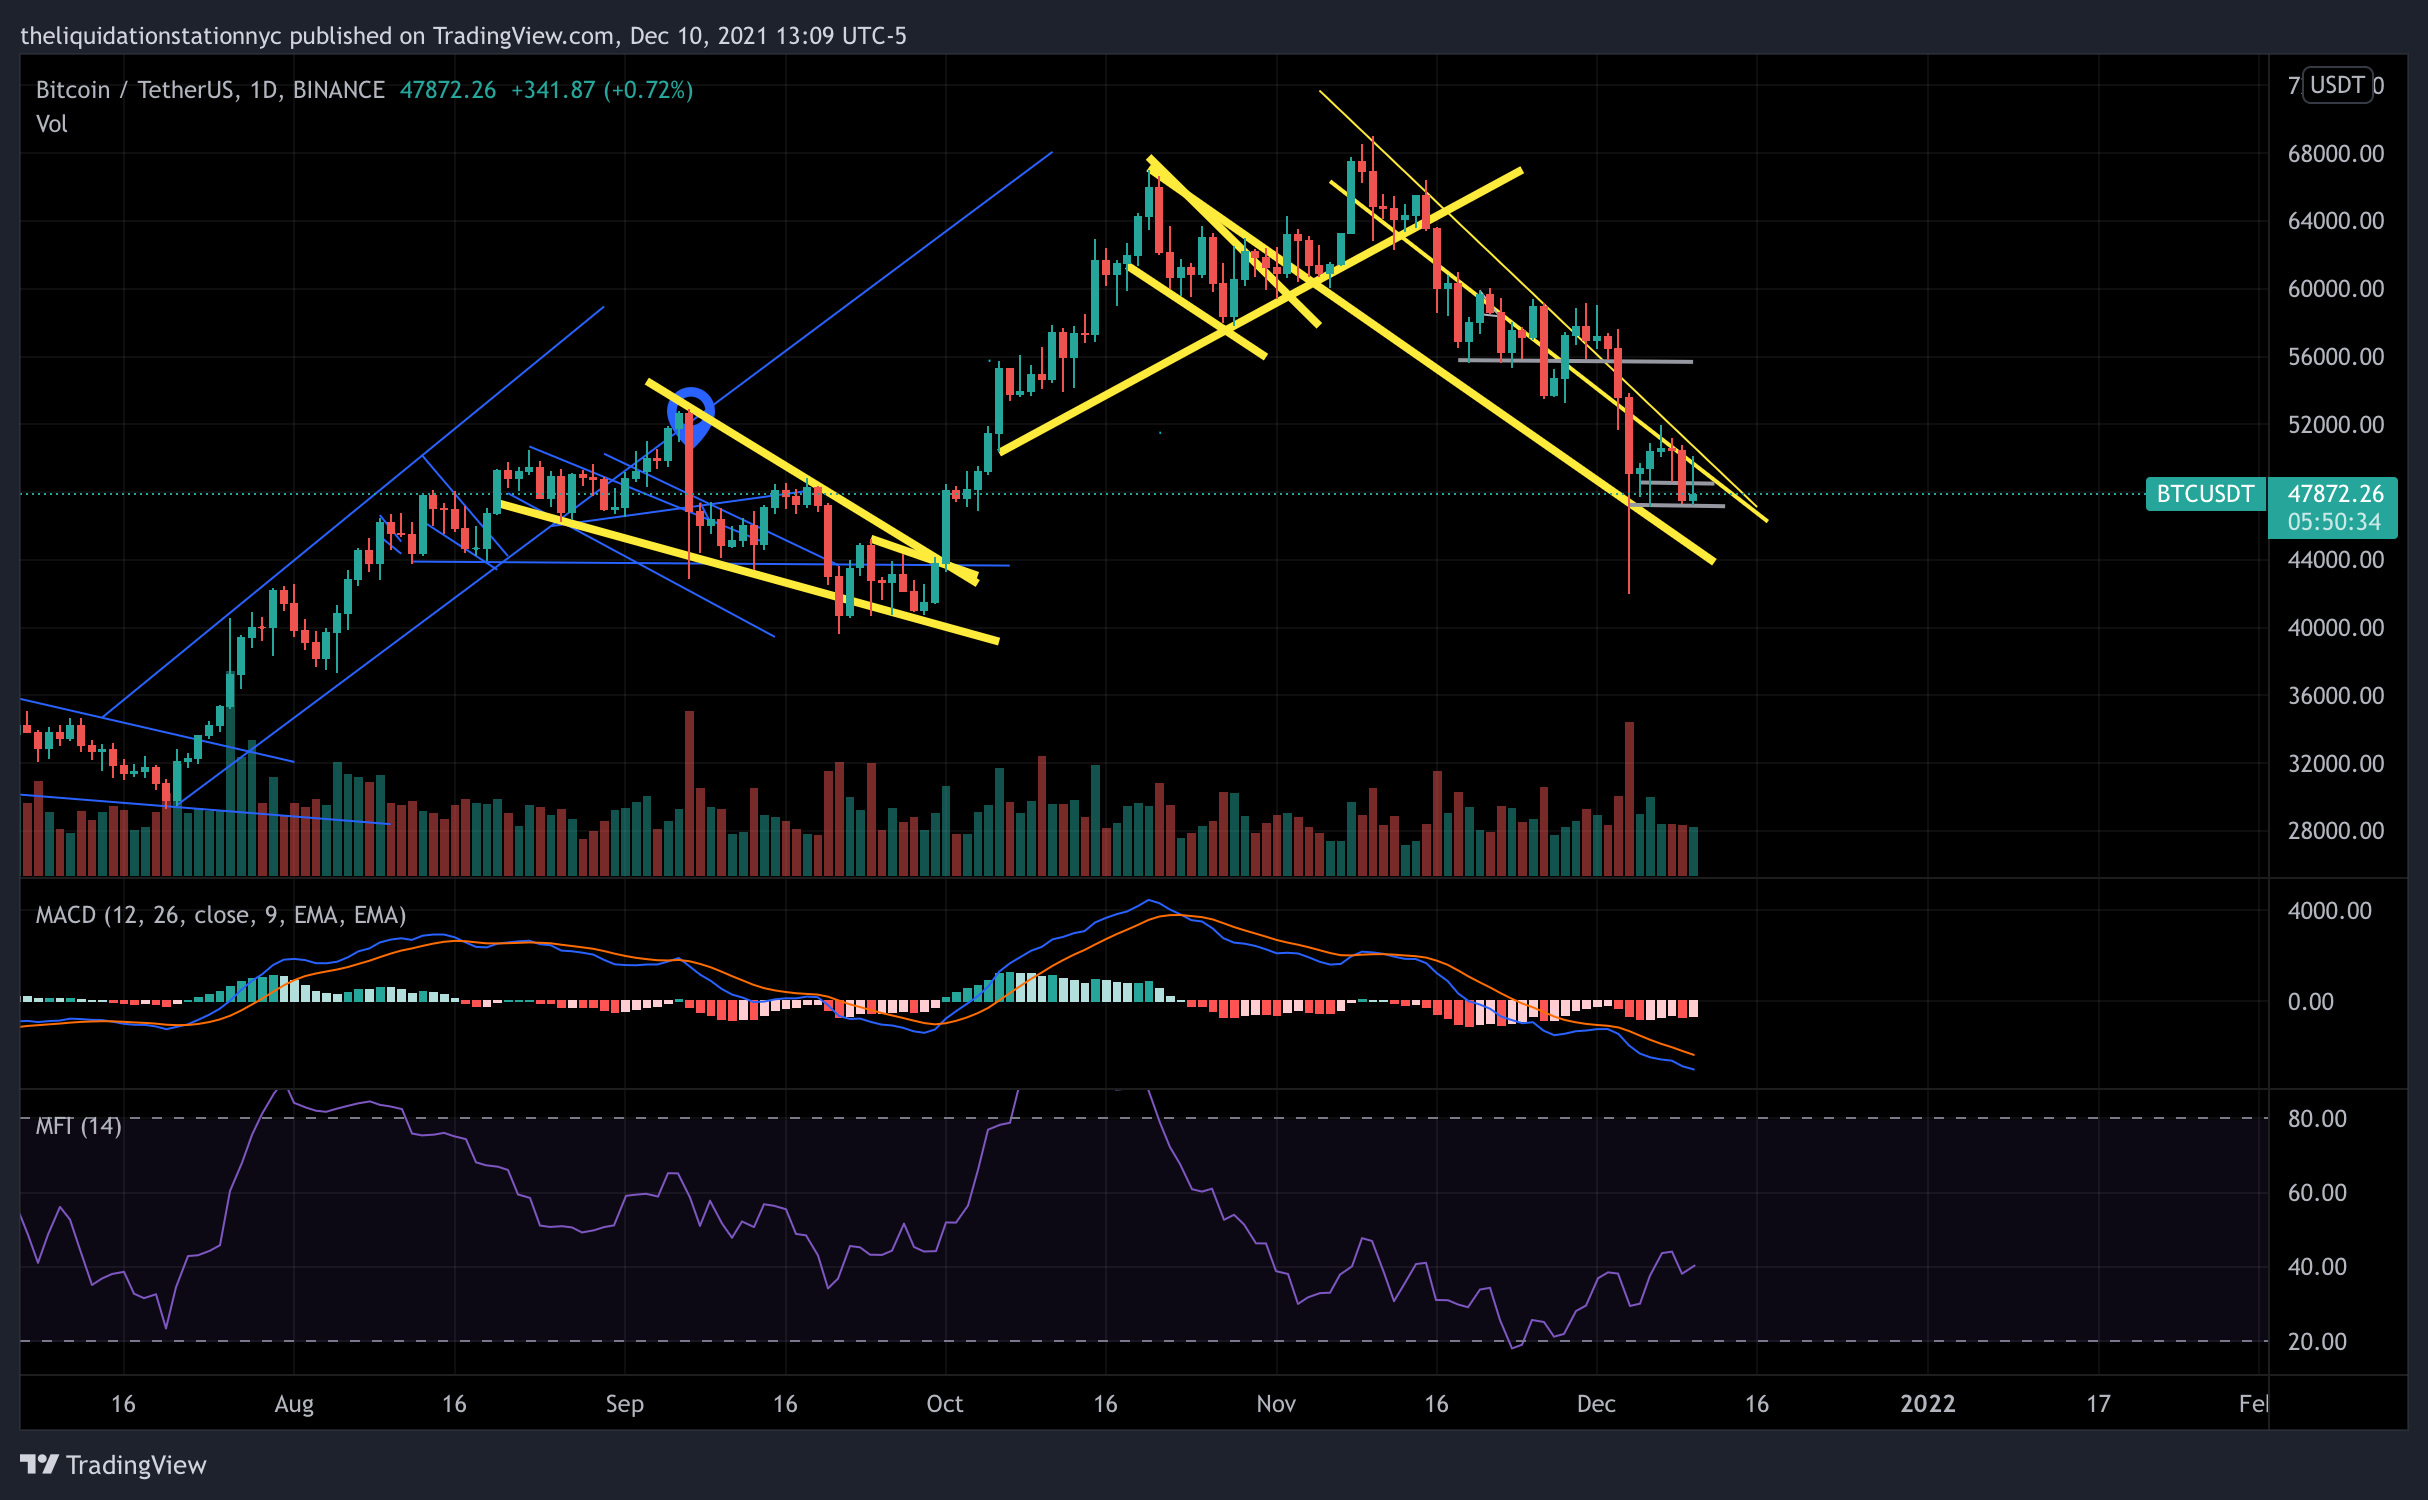
The BTC daily chart is having some bullish divergence on its MFI, with price descending slightly while the MFI starts to uptrend.
The MACD is holding fairly steady in the negative territory, still waiting for a definitive swing upwards in momentum. BTC is testing a fairly strong support currently around $47,500.
The overall cryptocurrency market cap is down to almost $2.2 trillion while the overall volume has increased to almost $110 billion compared to this morning.

ETH is currently testing resistance as the MFI remains fairly neutral with the MACD swinging down on the daily chart. It’s likely that ETH will continue to follow BTC’s movement. We shouldn’t be surprised if until BTC breaks this downtrend, ETH will struggle to recover as well.