
BTC Tests Support

BTC 4hr candle chart, approximately 9:10 am ET, 10/13/21.
BTC has taken a dip on the 4-hour candle chart after peaking at around $57,500. The MACD is trending downward with the momentum showing potential signs of either swinging further downward or holding in this area depending on the strength of the support. The MFI is starting to approach oversold territory as well.

BTC daily candle chart, approximately 9:40am ET, 10/13/21.
The daily chart is telling a different story. The MACD is looking like momentum may swing downwards and the MFI is well into overbought territory. This coupled with the testing of resistances closer to $60,000 could mean that we may see a slight short-term correction before the weekly close.
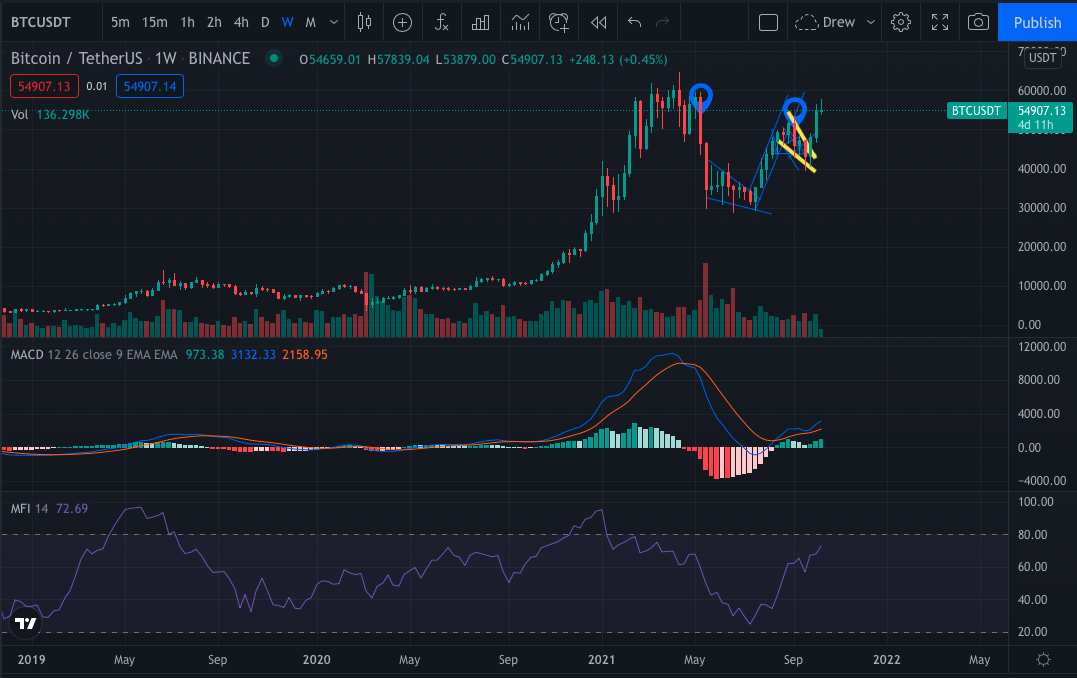
BTC weekly candle chart, approximately 9:55am ET, 10/13/21.
The weekly candle chart on BTC is looking mostly neutral other than the MFI with that slowly creeping into overbought territory.
The overall cryptocurrency market cap has dipped below $2.28 trillion. BTC market cap dominance and Ethereum dominance have dipped to 45.^% and 17.9% respectively.