
BTC Morning Moves
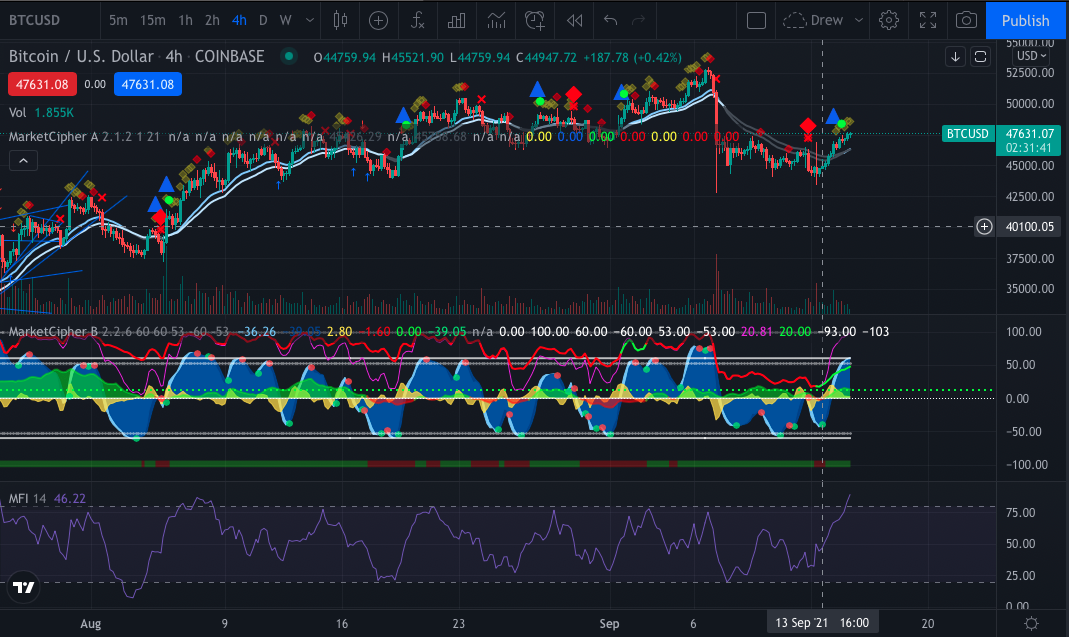
BTC 4hr chart as of 9:25am ET, 9/15/21.
BTC is slipping into MFI overbought territory on the 4hr candle chart, and momentum could also be gearing up to swing downward as well. This could signal a potential small dip in the shorter term in the coming 4-hour candles. However, the daily candle chart is telling a slightly different story.

BTC daily candle chart as of approximately 10am ET, 9/15/21.
The daily chart is showing a buy signal on the momentum on Marketcipher, and the MFI is solidly in the middle (neither overbought nor oversold). Bitcoin consolidated and found support over the past week or so in the mid 40,000s until yesterday’s green candle and today’s continuation of that with another green candle.
Currently, BTC is testing resistance around the 48k mark or so.