
$AVAX Analysis
In this post I will analyze the price action of Avalanche ($AVAX) focusing on the AVAX-USD trading pair on Coinbase.
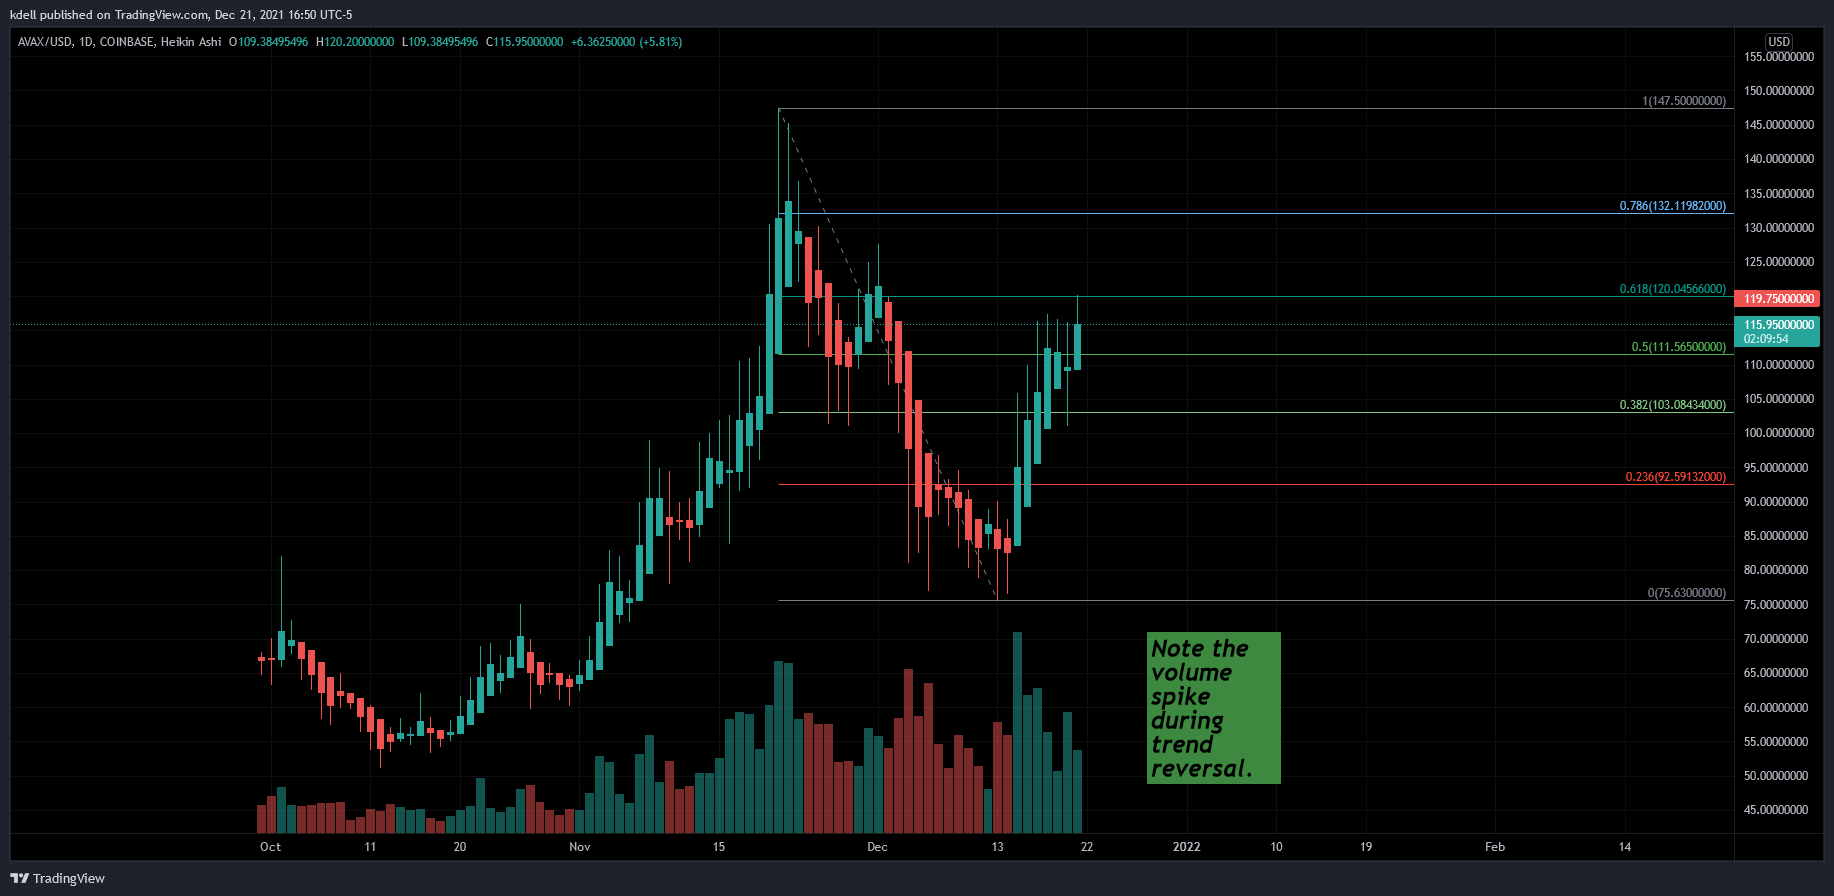
AVAX has experienced a large valuation increase from its initial offering on Coinbase in September 2021 where it was originally traded at $67.39 per coin. The coin has reached all time high prices on November 21st where it surged to $147.50. Following the downtrend that Bitcoin ($BTC) established in late November/early December, AVAX has since fallen in valuation along with most of the cryptocurrency market to lows around $80 per coin.
Looking at the daily chart, AVAX appears to have reversed its severe downtrend in a move against the overall cryptocurrency market downtrend, producing higher highs and higher lows from December 14th to the present day. The corresponding levels of volume below the price candles from December 14th onward indicate that there was large amounts of trading within the currency pair where ultimately buyers would overtake the amount of sellers. This overall trend reversal from the 14th is not only supported by the increased amount of volume observed but also the recent newer high found today of $120.20. For the time being, price appears to have hit a level of resistance at the .618 fibonacci level of $120.04.

Taking a closer look at the 4hr chart we see acting as support below the current price is the .5 fib level of $111.56 and the .382 fib level of 103.08 which has served as a significant level of support and resistance numerous times from November 8-16th, November 26th-28th, and December 15th to the 20th. If BTC were to fall from its recent valuation of $48k back into the $46-47k price range, the aforementioned price levels could provide insight on where AVAX could eventually fall to.