
9/9 Chainlink ($LINK) Analysis
In this article I will analyze Chainlink’s technical price data on the following charts: Daily and 1 hour Heikin Ashi candlestick chart.
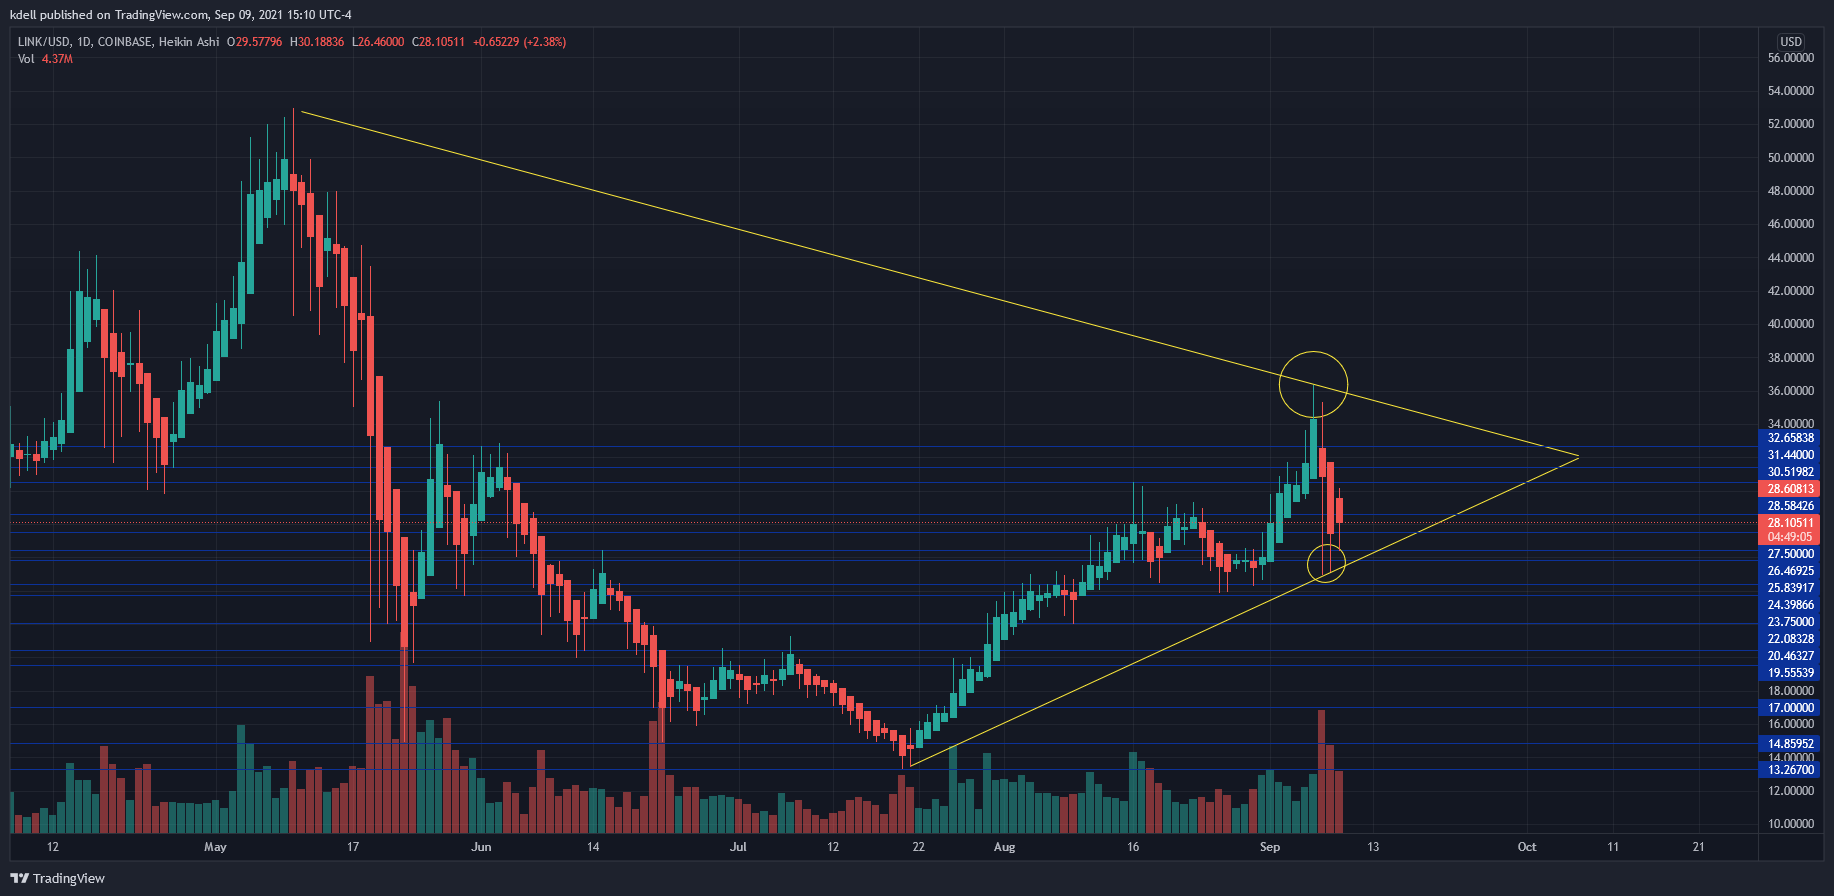
Here we see Chainlink on the daily Heikin Ashi candlestick chart. It currently is in the lower range of the pennant formed from the very height of $52.18 on May 10th, 2021 and the low of $13.45 on July 21st, 2021. It recently hit a low of $25 on September 7th but the overall uptrend is still intact. We see the more immediate downtrend started from 9/7 begin to diminish in strength as each candlestick body gets smaller in comparison to its wicks which get longer. The daily selling volume has begun to decrease, further supporting the possible trend reversal. The most recent 3 days are looked in further depth in the following chart of the 1 hour Heikin Ashi candlestick chart.

Above we see the Chainlink ($LINK) 1 hour Heikin Ashi candlestick chart form a pennant within the greater pennant candle formation that the daily chart has formed. Here we see $LINK fall to a low of $25.00 dollars on 9/7 during the 11:00 AM EST candle, a test of the greater uptrend and pennant formed in the daily chart. The “mini” pennant formed on the 1 hour chart begins at the high of $32.49 seen in the 10:00 AM EST candle on 9/7, and the low of $25.15 during the 4:00 AM EST 9/8 candle. The overall uptrend remains intact here, with buying volume slowly accumulating over time compared to selling volume.