
Could We See Further Corrections?
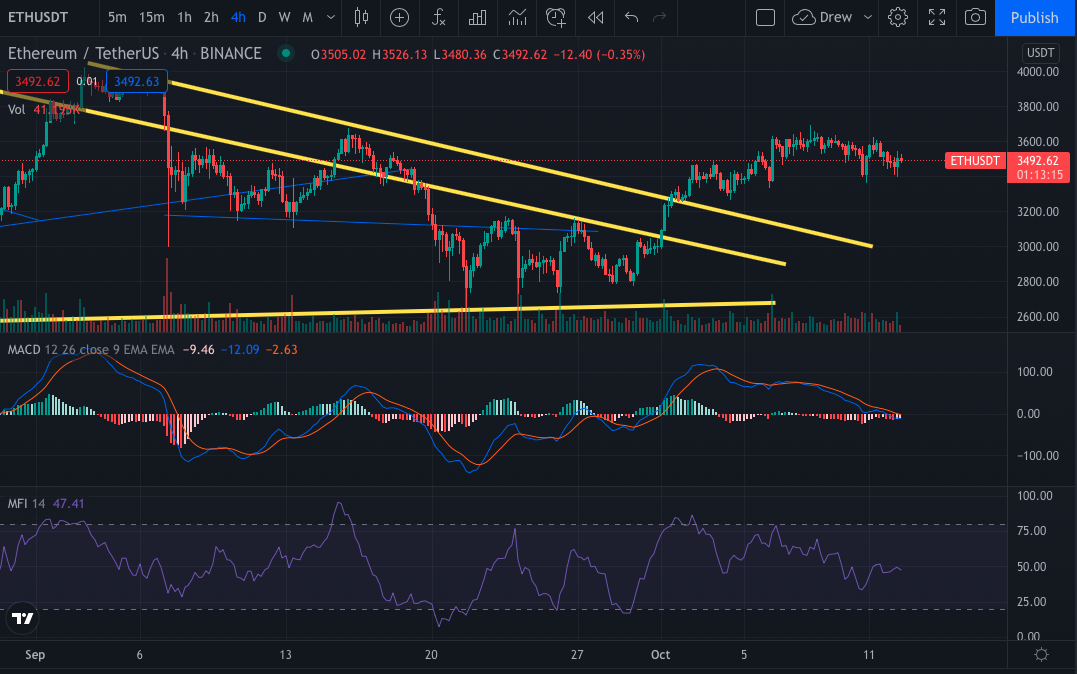
ETH 4 hr candle chart, approximately 2:45pm ET, 10/12/21.
Ethereum is taking a slight dip following BTC’s drop to $55k. Dipping down from its $3,600 level BTC is settling in the high $3,400s as support.

ETH/BTC daily candle ratio, approximately 2:55pm ET, 10/12/21.
Ethereum is holding above a longer-term area of support but is hitting an area of resistance here. That being said, the support seems strong so we may see ETH prepare to outpace BTC if this support in the ratio holds.