
BTC Rides Support
Neither this post nor any other on cryptofal.com should be taken as financial advice. It is not.
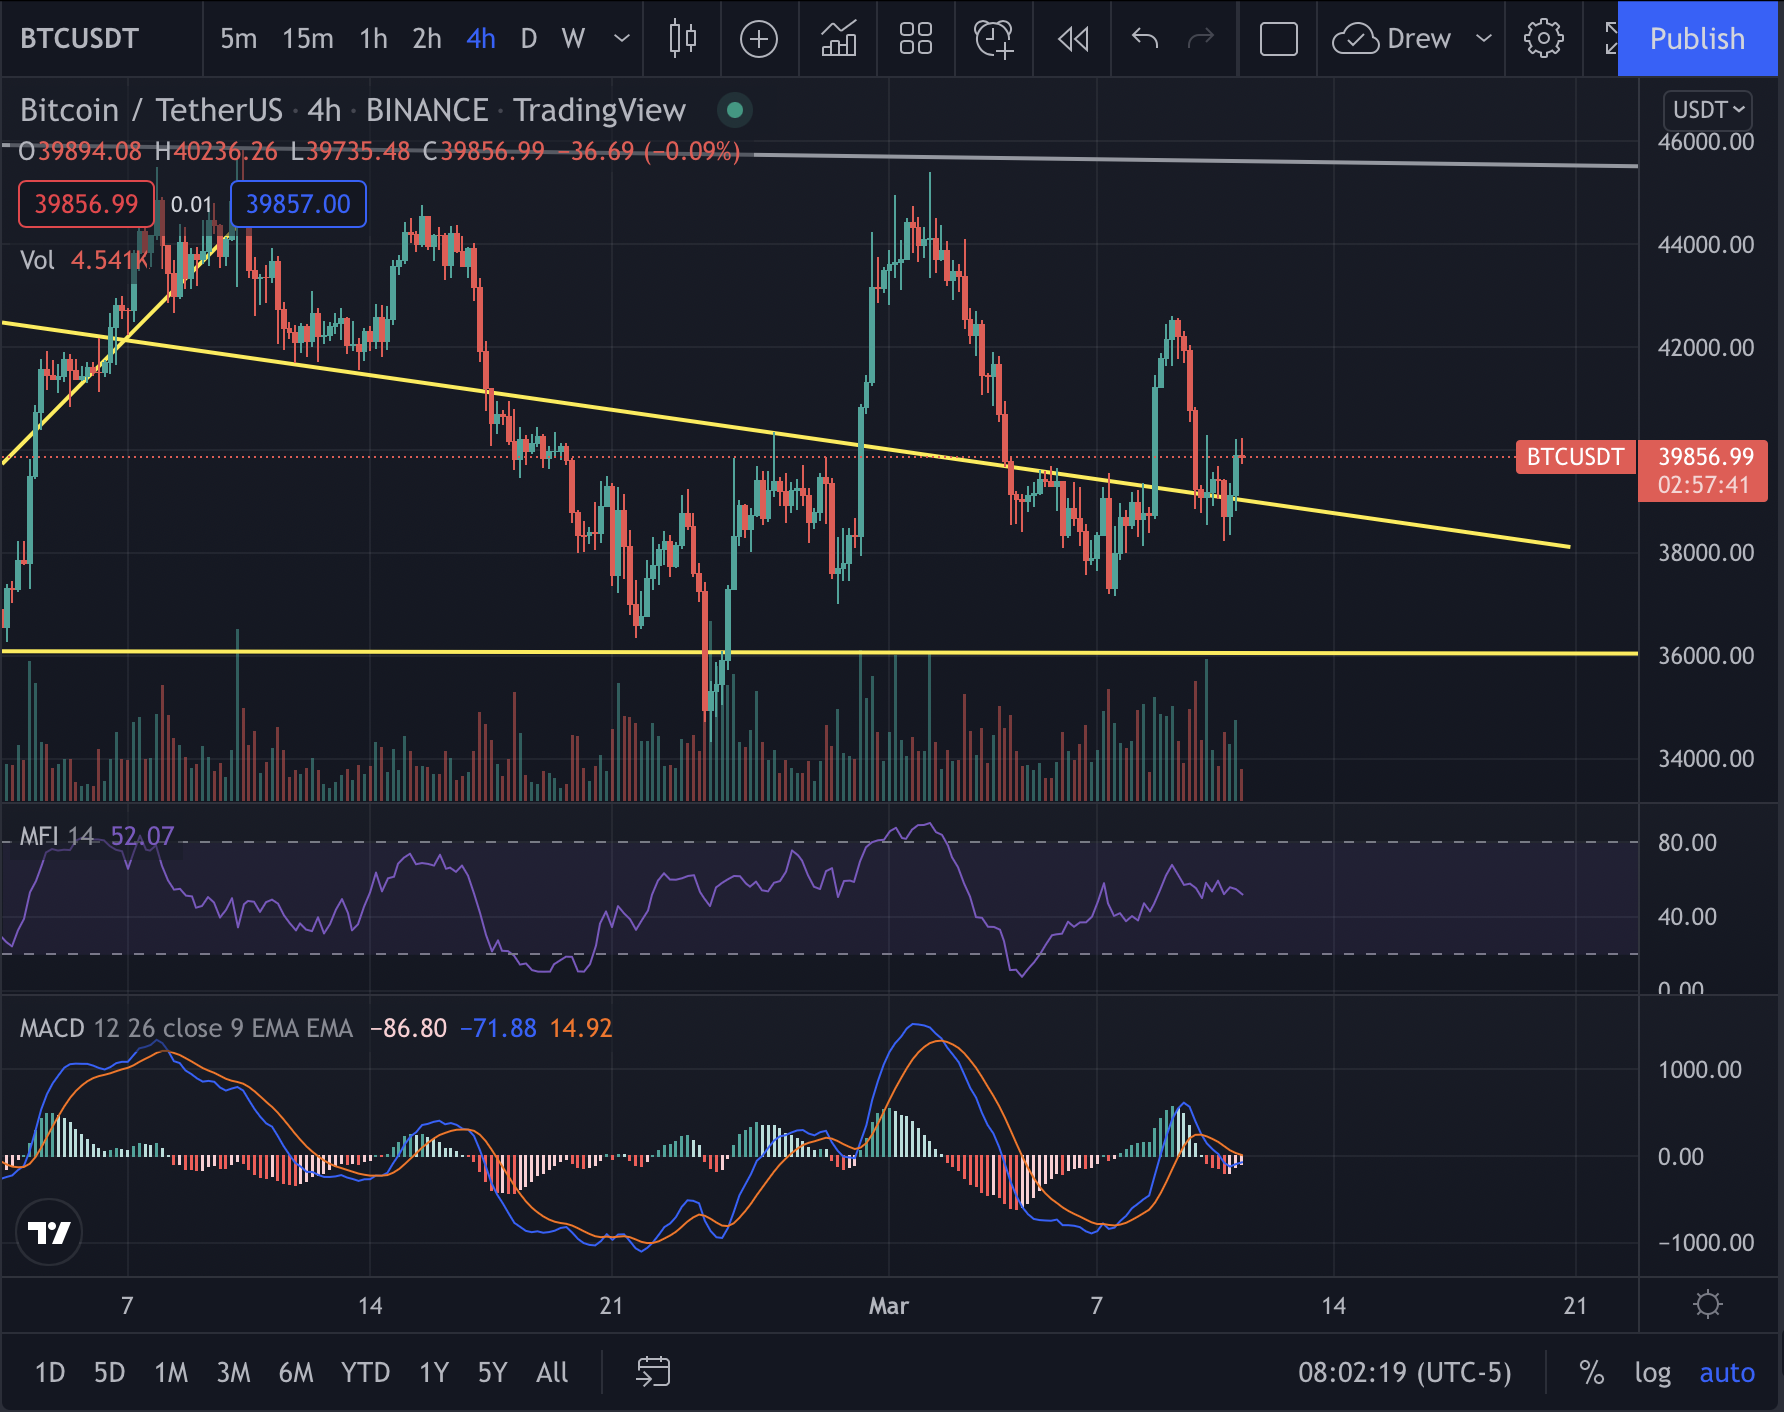
BTC 4-hour candle chart, 3/11/22.
BTC is currently riding support downwards as volume slowly attempts to decrease on the 4-hour candle chart.
The MFI is currently moving fairly neutrally on BTC’s 4-hour chart after having a fairly strong uptrend over the last week. The MACD looks like it could be attempting to swing upwards, which could be a good sign for momentum. It’s likely that with an influx of volume, we could see BTC prepare to test $42.5k once more. If it breaks this, it wouldn’t be surprising if we start to see BTC prepare to test the $45k range once more.
The overall cryptocurrency market cap is currently just below $1.8 trillion, with a volume of approximately $87 billion. BTC dominance is currently at 42.6% with ETH dominance holding fairly steady around 17.9%.

ETH to BTC weekly ratio chart, 3/11/22.
With Ethereum dominance down, it’s not too surprising to find that the ratio has been struggling/consolidating for a while. On the weekly chart, the volume traded in the ETH to BTC ratio has decreased significantly. After breaking above resistance before the new year, ETH has yet to test above this range again.
The MFI and MAD have taken strong swings downward, which could mean that ETH may prepare to outpace BTC at some point in the coming weeks, but we’ll just have to see.