
BTC Pushes Above $40k
Neither this post nor any other on cryptofal.com should be taken as financial advice. It is not.
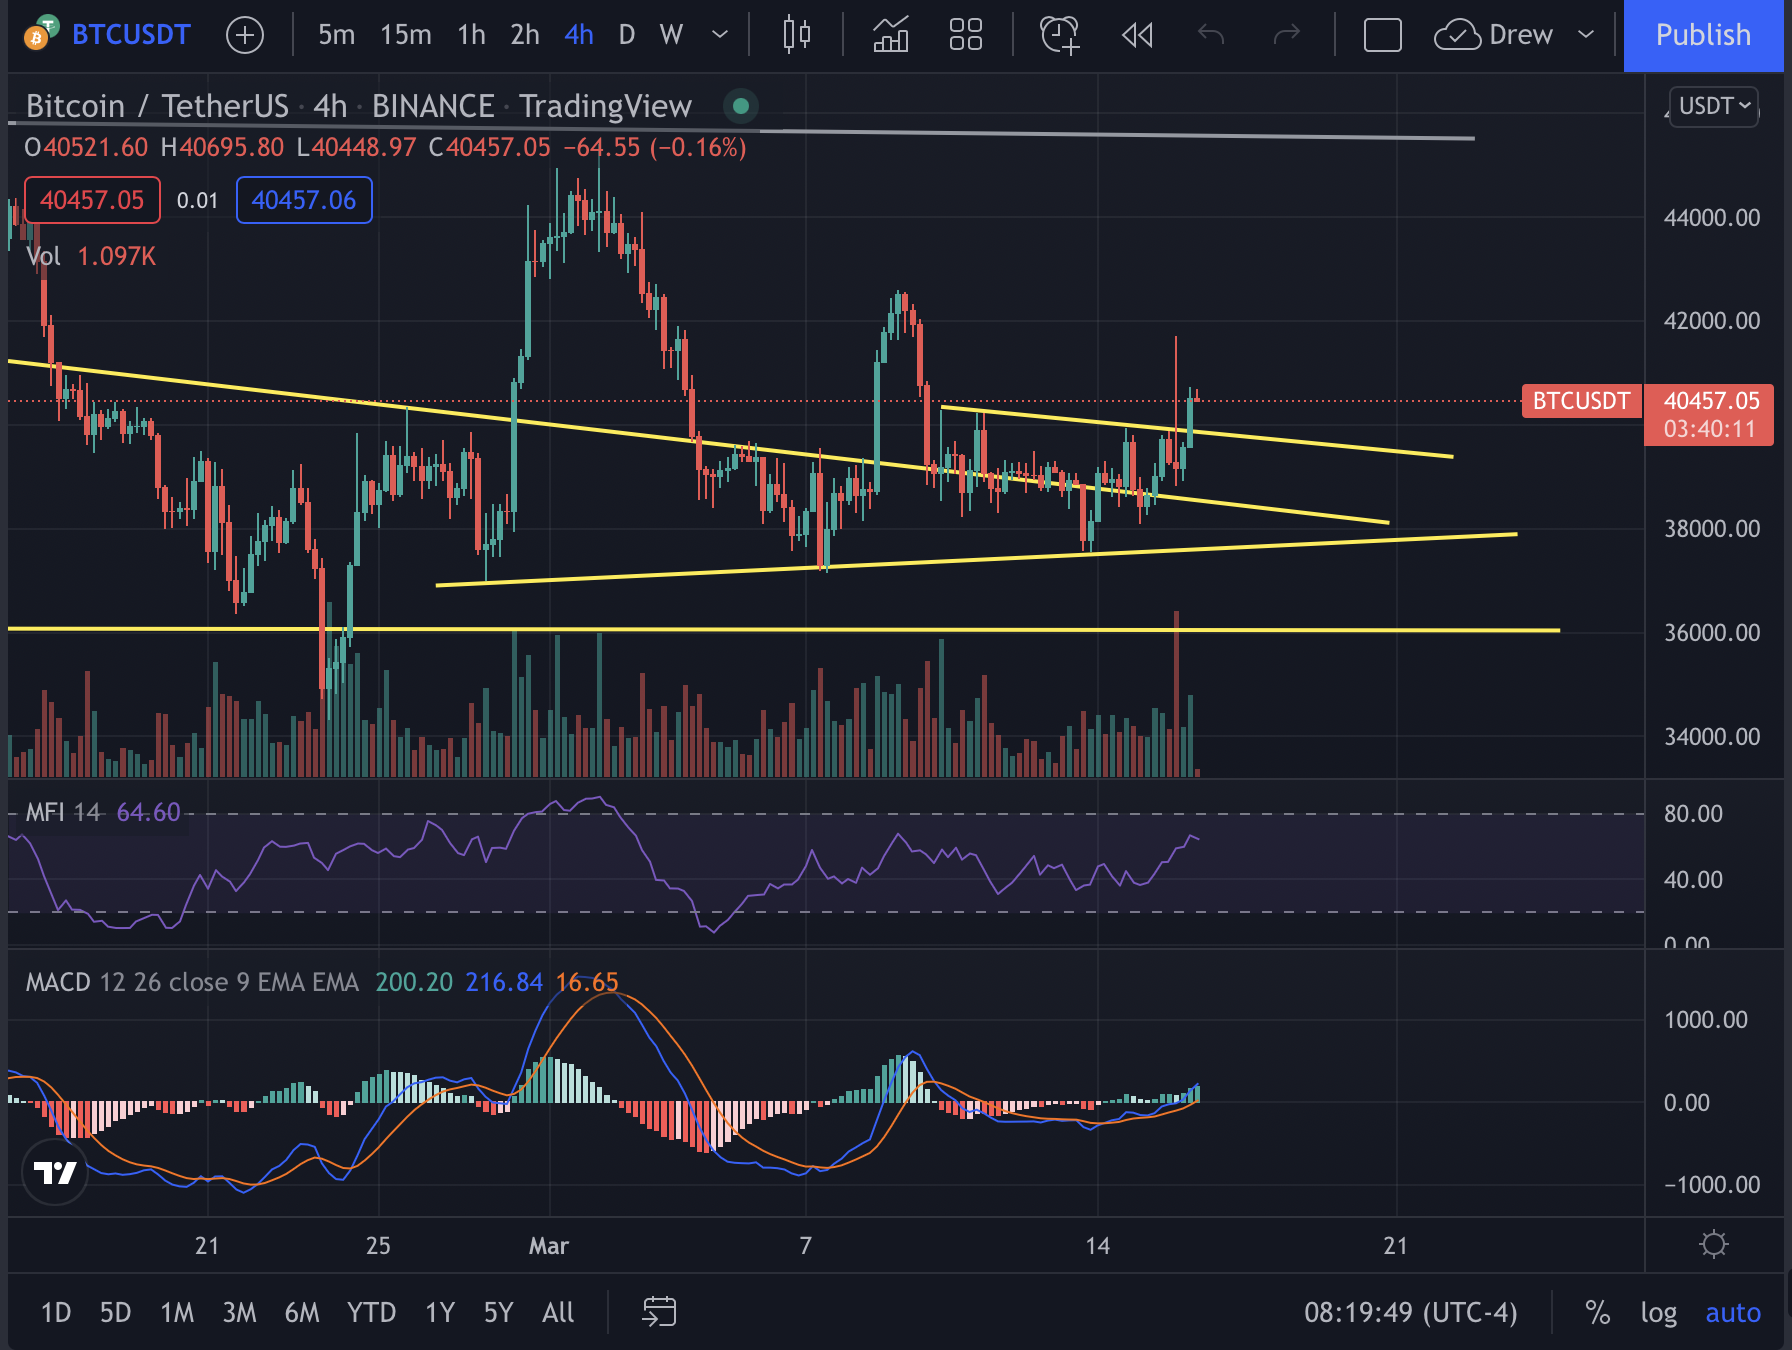
BTC 4-hour candle chart, 3/16/21.
BTC has broken resistance and is making an attempt at trending upwards on its 4-hour candle chart into the morning.
This is after the EU dropped parts of their regulatory MiCA bill that would have heavily restricted proof-of-work cryptocurrencies. While last night there was a major spike in volume that pushed the price up strongly, it wasn’t able to maintain so it plummeted down in the same candle creating a massive wick. Luckily, BTC held support and prepared to test upwards once more until a short-term resistance was broken. If BTC is able to maintain support in this area it’s very possible it could keep pushing.
The MFI is on a fairly strong uptrend as it nears overbought territory while the MACD is looking as if it could swing upwards fairly significantly. The overall cryptocurrency market cap is currently around $1.78 trillion with a volume of approximately $94 billion. BTC dominance is currently at 43% with ETH dominance at 18%, meaning BTC and ETH are taking larger shares of the overall market from altcoins.

ETH 4-hour candle chart, 3/16/22.
Ethereum has been trending upwards since yesterday after testing support for almost a week. It’s very possible that ETH could encounter a bit of resistance between where it’s at currently and $2,800 or so.
Similar to BTC, the MFI is trending upwards and so is the MACD. If BTC keeps pushing, it’s likely ETH will lead altcoins and follow.