
Bitcoin Tests Support from August
Neither this post nor any other on cryptofal.com should be taken as financial advice. It is not.

BTC daily candle chart, approximately 3:20 P.M., 1/21/22.
Bitcoin has been struggling since yesterday’s announcement of the Fed revealing their study on a digital dollar. Unfortunately, they did not announce whether or not they’re taking a position on this one way or the other.
On the technical side of things, it is looking like BTC could continue to dip if support isn’t found. We have not tested this range since August. The next area of support is closer to $36.5k. The MFI is continuing to border oversold territory, as it has been for much of this month. The MACD is attempting to swing downward however, it is still fairly neutral currently. It should be noted that volume is increasing on the daily chart into this uptrend, so it would not be surprising if we find continue to see volatility.
The overall cryptocurrency market cap is currently at $1.7 trillion with volume now up to approximately $115 billion lows around $50 billion for a couple of days. Bitcoin dominance is up slightly, which is not too surprising during these larger dips. BTC dominance is currently at 40.6% at the time of posting, and ETH dominance is at 18.4% at the time of posting. Altcoins and ETH are getting hit harder than BTC as stop losses within those trading the ratios are hit as well.
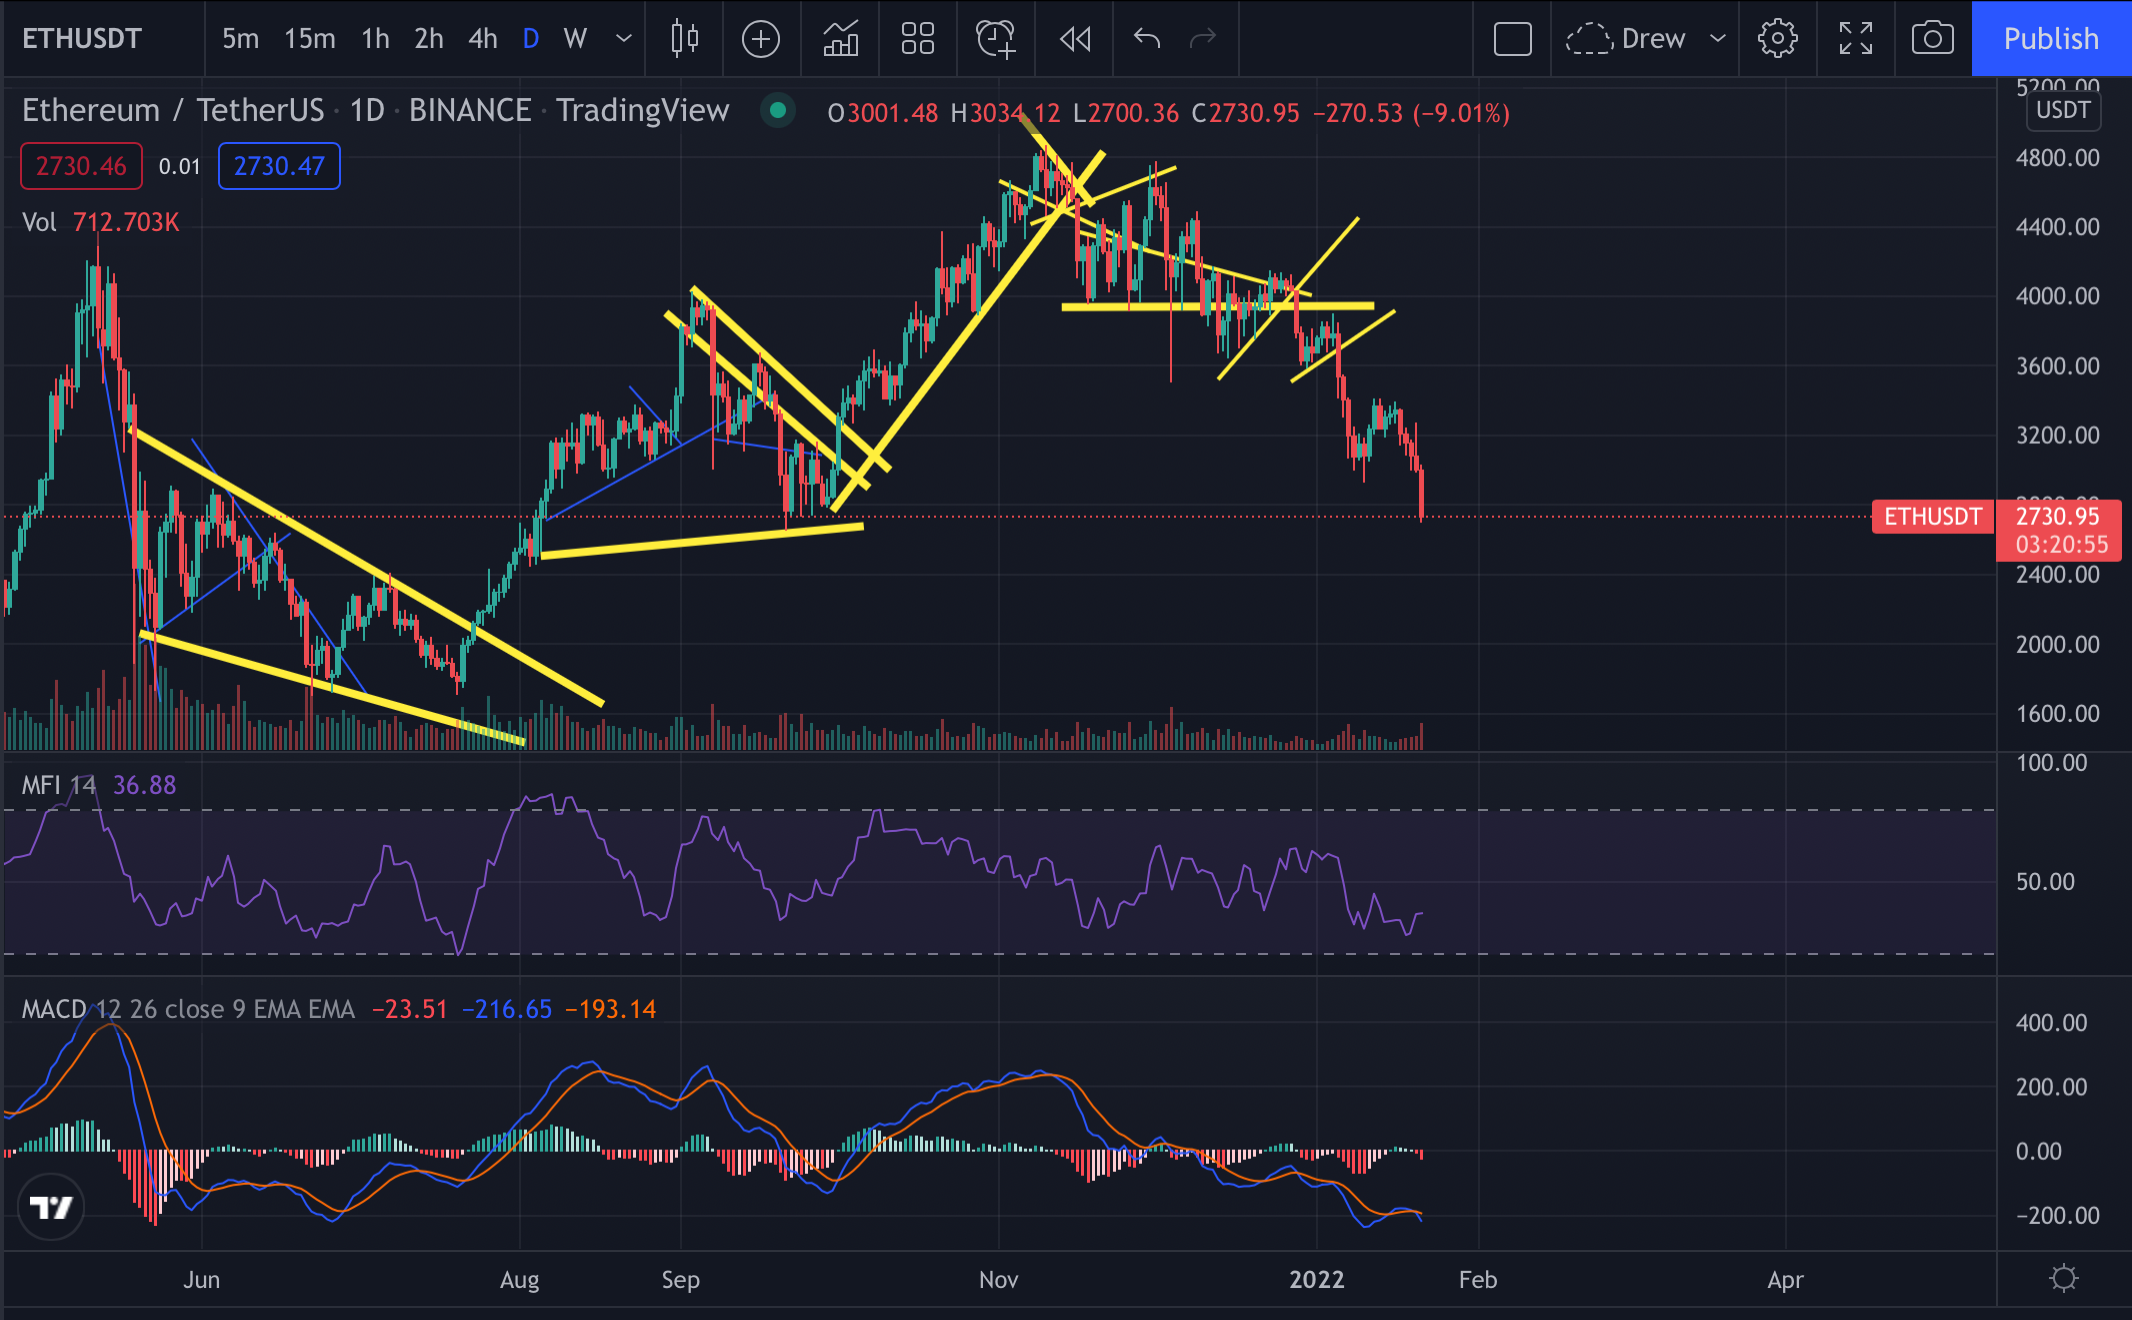
ETH daily candle chart, approximately 3:40 P.M., 1/21/22.
Ethereum is struggling even more strongly than BTC with it seeing about 15% in losses over the past 24 hours according to coinmarketcap.com at the time of posting. This will be the third time in the last six months or so that ETH has tested this range. Its MFI is bordering oversold territory and its MACD is attempting to swing down further. It wouldn’t be surprising if we continue to see volatility in both ETH and the broader altcoin market until BTC settles.