
Bitcoin Prepares to Test Resistance Once More
Neither this post, nor any other on cryptofal.com should be taken as financial advice.
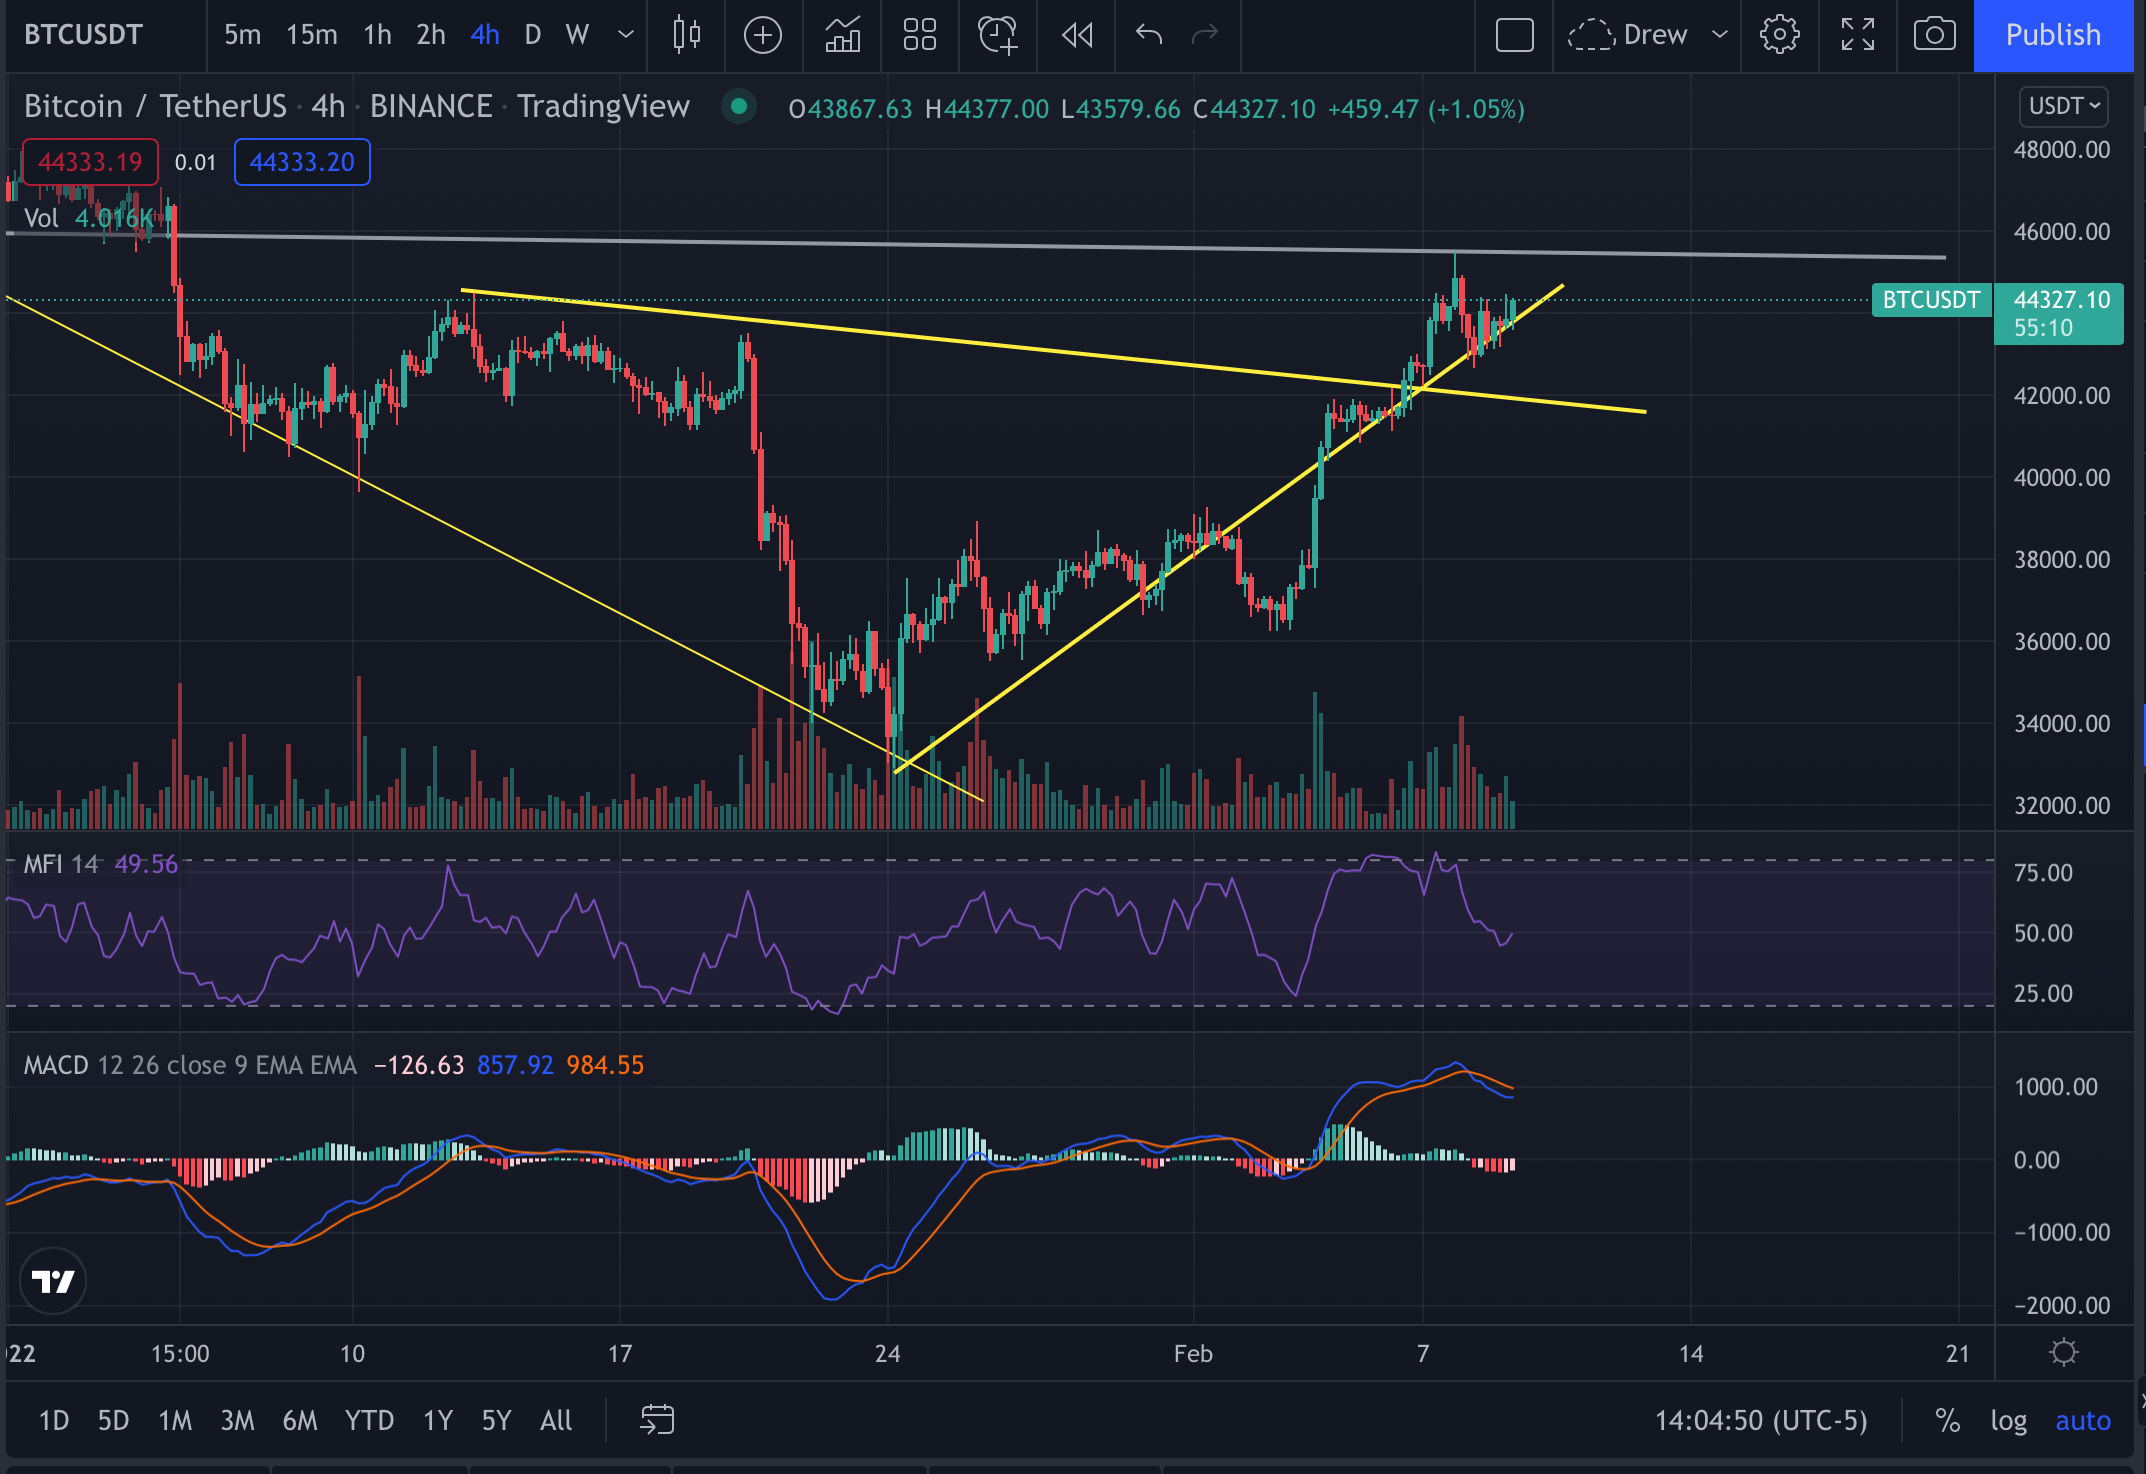
Bitcoin 4-hour candle chart, approximately 2:10 P.M. ET, 2/9/22.
Bitcoin is currently riding support upwards as it prepares to test resistance once more.
BTC’s MFI is making an attempt at swinging upwards and so is its MACD. If this type of momentum continues, not only is BTC likely to test resistance once more, it’s very possible it could break resistance and move higher as well.
The overall cryptocurrency market is currently nearing $2.05 trillion with the overall volume holding around $82 billion. BTC dominance is still dipping, hitting 41.3% with ETH dominance climbing to 19%. Ethereum dominance seems to be gaining strength as ETH looks to outpace much of the broader cryptocurrency market.

BTC weekly candle chart, approximately 3:30 P.M.
On the weekly chart, BTC is looking fairly strong. It’s looking like it could test long-term former support turned resistance around $47.6k if it breaks shorter-term resistance around $45.5k. Volume is dipping slightly, so it may take an influx of buy-side pressure to push it over this resistance.
The MFI is bordering oversold territory and the MACD looks as if it could be preparing to trend upwards as well.