
Bitcoin Powers Through Resistance
Neither this post nor any other on cryptofal.com should be taken as financial advice. It is not.
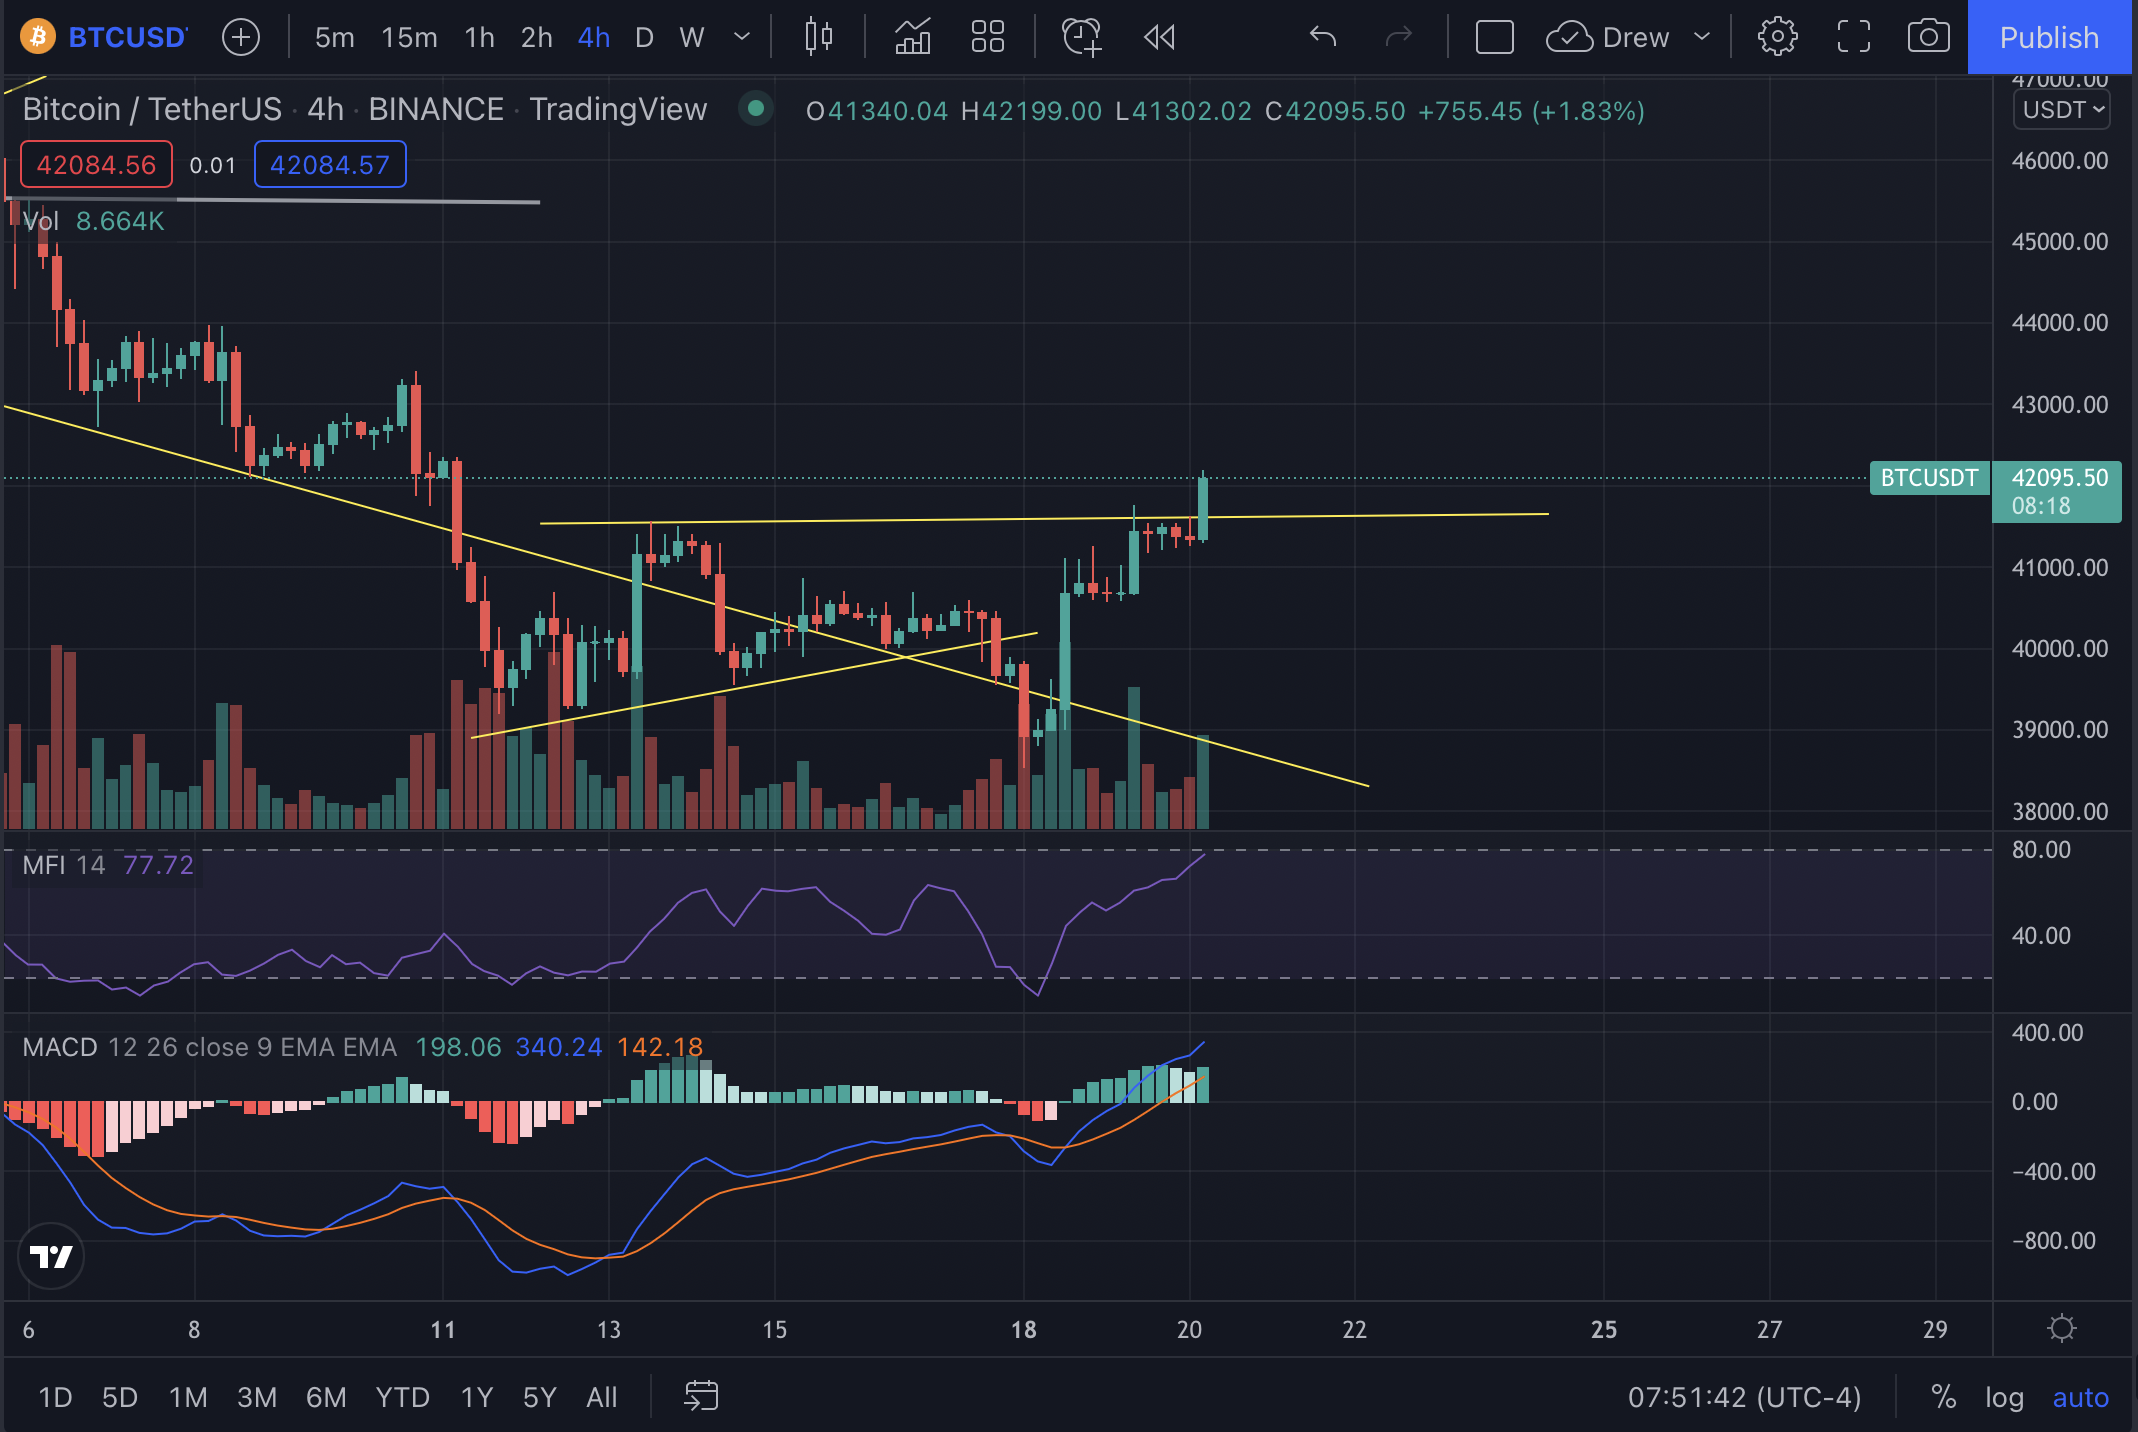
BTC 4-hour candle chart, 4/20/22
Bitcoin is currently powering through resistance after struggling last night around the $41.5k range.
BTC is currently hovering around $42k as it attempts to continue pushing upwards. If BTC is able to settle in this range, that could be a good sign for continued bullish market sentiment. However, if it does test downward, it would also be a good sign if that former area of resistance turns into an area of support of around $41.5k. It should be noted that this occurred alongside an influx of buy-side pressure after the volume was struggling a bit last night as it tested resistance.
The MFI is currently preparing to test overbought territory as it continues to trend upwards. The MACD started to swing downward slightly last night, however, both the momentum waves and the EMA lines are both swinging upwards after BTC’s morning movement. With the way these have swung upwards, it’s possible that we may be in store for a slight downswing within the coming days or weeks.
The overall cryptocurrency market is currently around $1.95 trillion with a volume of approximately $91 billion. BTC dominance is at approximately 41% with ETH dominance at about 19.4%. This means that both altcoins and ETH are holding relatively steady in their ratios to BTC and that most of the market is moving together.

ETH/BTC daily candle ratio chart, 4/20/22
The ETH to BTC ratio chart has held fairly steady over much of April, as the market has moved close together most of this month. The MFI is trending upwards, however, momentum from the MACD is trending downwards. Until more fundamental developments regarding ETH’s merge come out, it wouldn’t be surprising to continue to see ETH follow BTC and the ratio remaining relatively steady.