
Bitcoin Breaks Support
Neither this post nor any other post on cryptofal.com should be taken as financial advice, it is not.
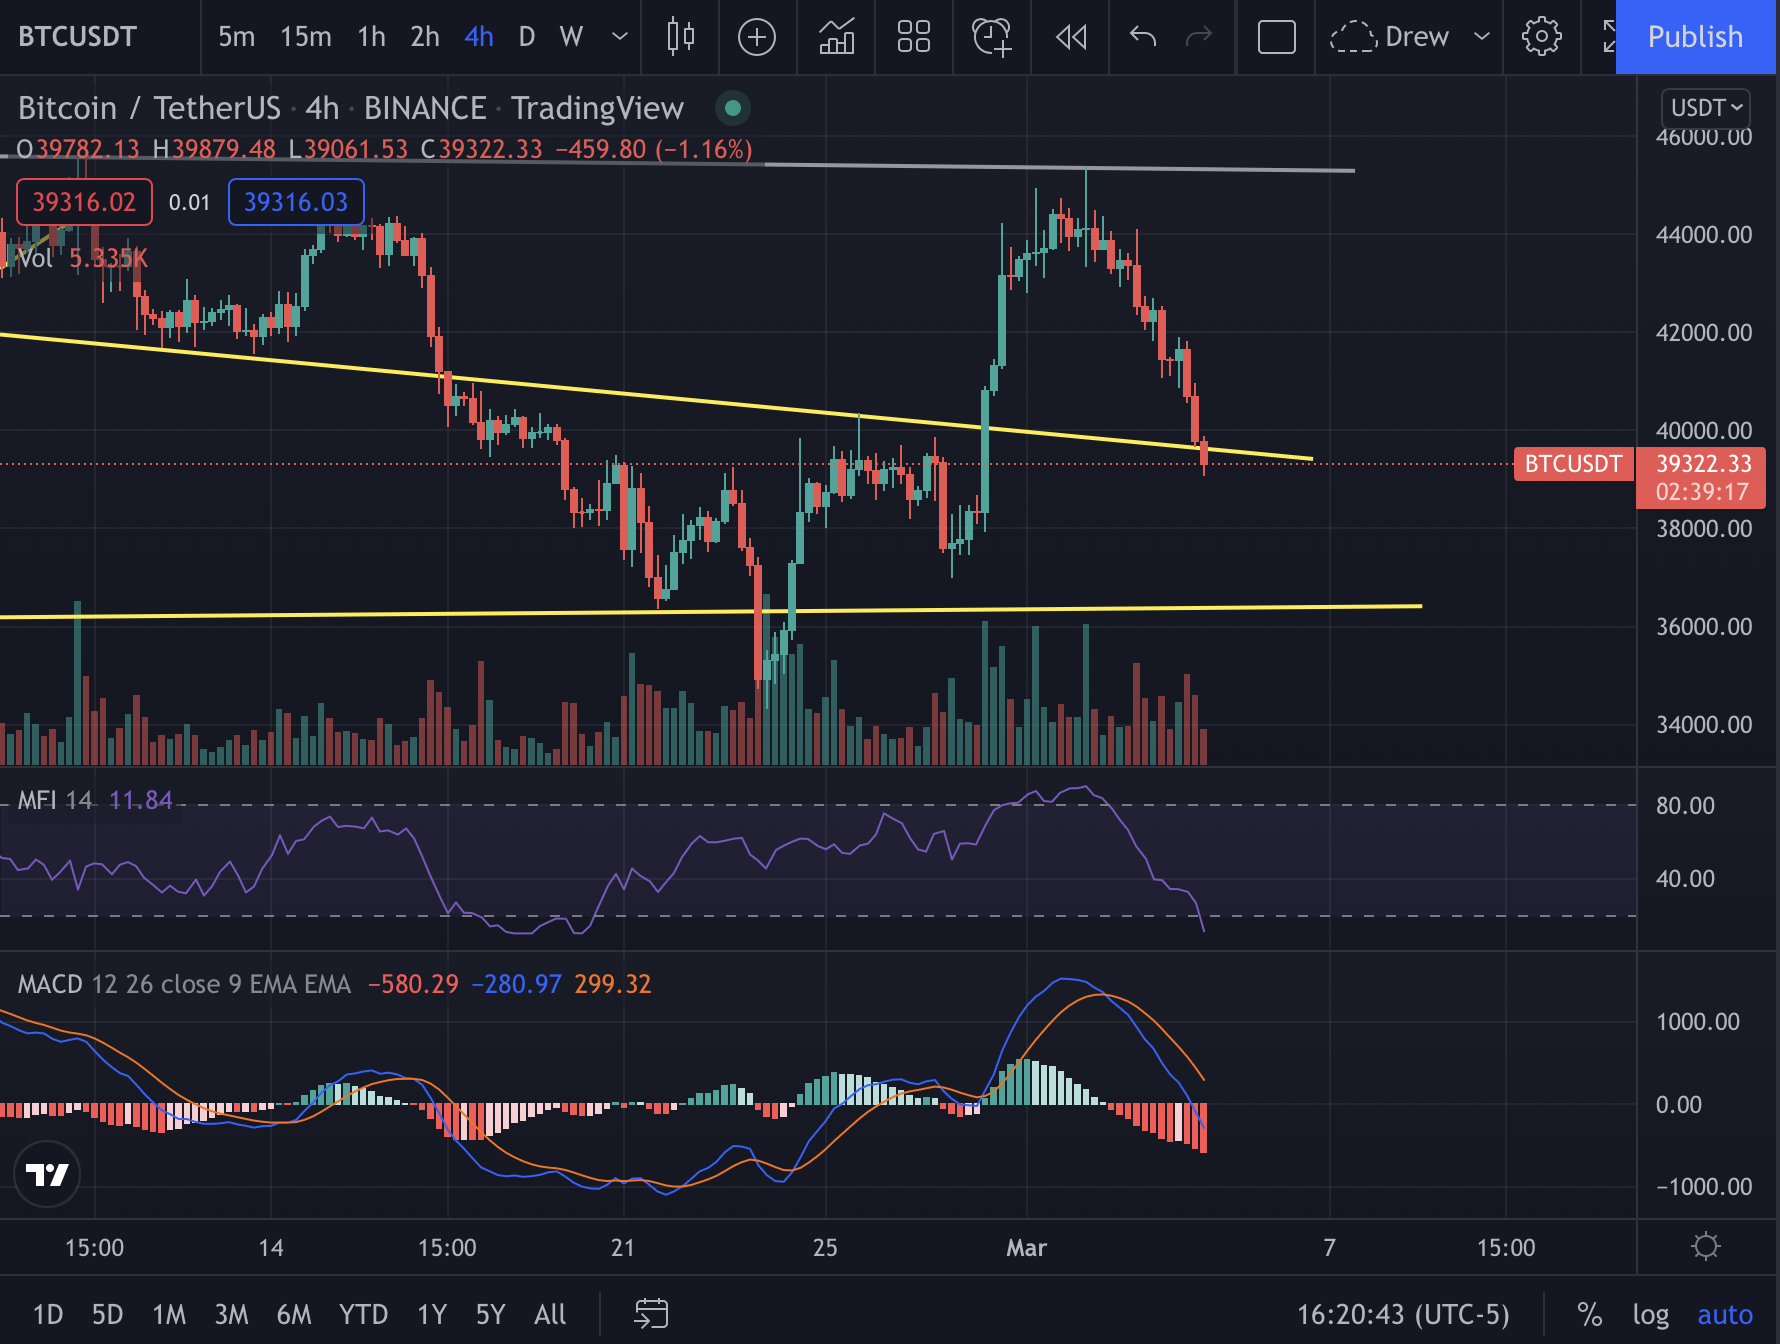
BTC 4-hour candle chart, 3/4/22.
Bitcoin has broken support after testing upper resistance and trending downwards strongly. Currently, it finds itself below $40k and looking as if it could keep testing downward.
Both the MFI and the MACD are trending downwards strongly. The MFI is now in oversold territory with the MACD looking to continue swinging downward. It should be noted that this volatility could also be affected by geopolitical conflicts as well.
The overall cryptocurrency market is currently at $1.75 trillion with a volume of about $86 billion. BTC dominance is at 42.5% and ETH dominance is at 17.8%.

ETH 4-hour candle chart, 3/4/22.
Ethereum is currently testing an area of support. Like BTC both its MFI and MACD have trended down strongly, however, it seems that ETH’s indicators are making a slight attempt at swinging upwards.
It’s likely that until BTC recovers, the rest of the market will continue to follow BTC’s movement.